
A checkout page starts timing out at 2 a.m. Alerts are firing, the dashboards are red, and three teams are already debating whose service is to blame. That is the moment application performance monitoring exists for. In 2026 it is also the moment APM is being asked to do far more than it used to.
Systems now span microservices, several clouds and AI agents that call tools on their own. The Business Research Company projects the APM market will grow from $12.06 billion in 2026 to $20.19 billion by 2030, which shows where budgets are going. Below are five APM trends worth planning for, with a practical first step for each. If you want the fundamentals first, start with our guide to application performance monitoring.
Key takeaways
- OpenTelemetry is making telemetry portable, so your instrumentation matters more than your vendor.
- Observability and APM are blending into one product category.
- AI agents are starting to investigate incidents, which means monitoring data now has machine readers.
- LLM and agent workloads need their own monitoring. Gartner expects dedicated AI observability tools to become common by 2028.
- Telemetry cost has become a buying criterion in its own right.
OpenTelemetry is becoming the common language for telemetry
OpenTelemetry is an open standard for collecting traces, metrics and logs from applications. More teams now instrument with it because the data stays portable across tools, which makes changing vendors far less painful and keeps monitoring choices flexible as needs change.
It also changes how distributed tracing works in practice. A trace that follows one request across many services used to depend on each vendor’s own agent. With OpenTelemetry, the same trace context can travel across services written in different languages and read by different tools. Instrument once, and the choice of backend becomes a business decision instead of a rewrite.
What to do: Standardize new services on OpenTelemetry instrumentation and keep your backend choice open.
Observability and APM are merging
Classic APM answered whether an application was slow. Observability platforms go further and help explain why, by combining traces, metrics, logs and profiling in one place. Many vendors now sell the two as a single product, so buyers should compare platforms on how well they connect signals, not just collect them.
This changes how you shop for APM tools. A platform that gathers every signal but makes you jump between screens during an incident will cost you time exactly when you can least afford it. A useful test: pick a real slow transaction and count the clicks it takes to get from the symptom to the failing service.
We cover why a traditional setup falls short in a quick video: Your APM Tool Isn’t Broken. It’s Just Not Enough Anymore.
What to do: Score every APM tool you evaluate on time to root cause, not on feature count.
AI agents are starting to handle incident work
AI-assisted root cause analysis uses machine learning or AI agents to trace an incident back to its cause, instead of leaving engineers to sift through alerts. The hard part of an incident is rarely spotting the failure. It is working out why it happened and whether a fix is safe.
In June 2026, New Relic announced Autopilot and Ground Truth: an automated SRE agent it operates for customers, and a way for a team’s own agents to pull insights from New Relic data. Both were slated for availability in summer 2026. The bigger point is that monitoring data now has machine readers as well as human ones, so its quality and governance matter more. Agents that investigate incidents lean on distributed tracing and service context to follow a failure across systems, which means they are only as good as the traces they can see.
For a deeper look at how this works, read our NASSCOM piece, How AI Observability Is Transforming Application Performance Monitoring.
What to do: Clean up service names, tags and trace coverage before you add any AI layer on top.
Teams are monitoring LLM and agent workloads
Teams now monitor LLM calls and AI agents the way they monitor APIs, tracking latency, errors, token usage and cost. OpenTelemetry has published GenAI conventions that define how to record model calls and tool use, which gives teams a common vocabulary for it.
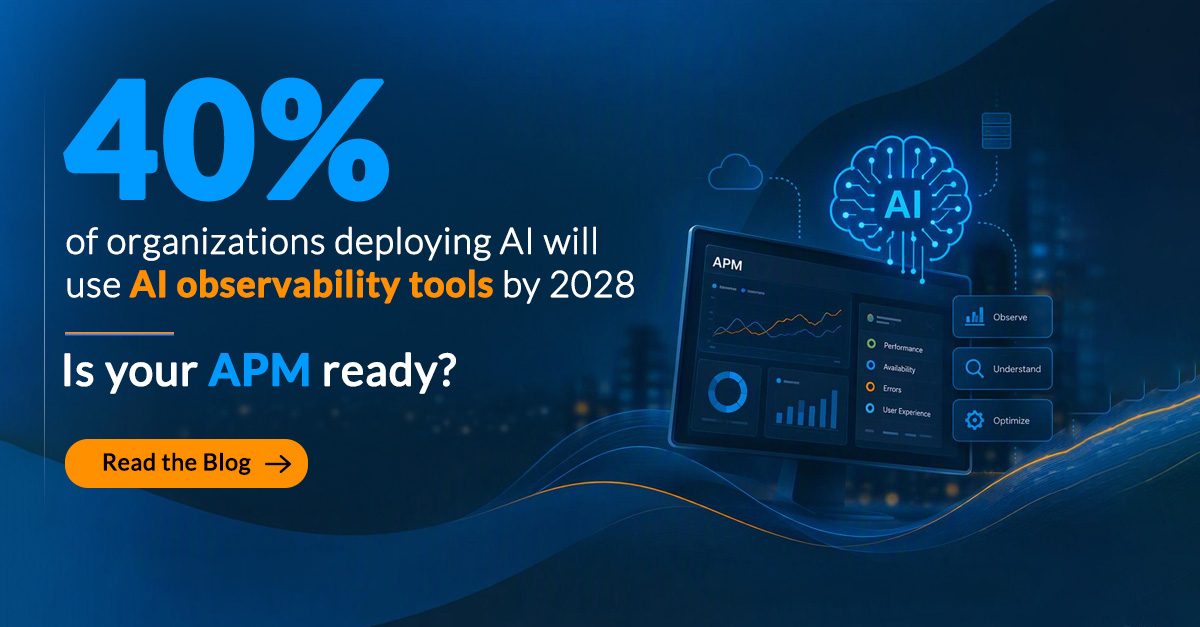
Analysts see the same shift. Gartner predicts that 40% of organizations deploying AI will use dedicated AI observability tools by 2028 to monitor model performance, bias and outputs. Its analysts point to executive worry about risk in complex and agentic AI, not just infrastructure health, as the driver. That is a different job from watching servers, and it adds a new layer to an observability practice.
One caveat is worth taking seriously. Those GenAI conventions are still marked as in development, so instrument against them but expect attribute names to shift. The project’s own walkthrough, Inside the LLM Call, is a good place to start.
What to do: Track latency, token usage and cost per request for every LLM call, then add quality checks.
Telemetry cost is now part of the buying decision
Telemetry volume often grows faster than budgets, so teams are choosing what to collect instead of keeping everything. Sampling, filtering and tiered storage cut costs while keeping the traces and metrics that matter during an incident.
Expect cost visibility to become a standard part of any evaluation of APM tools. Ask vendors how pricing scales with data volume, whether you can filter before ingestion, and what it costs to keep data for longer.
What to do: List which signals you collect, who uses each one, and set retention by value rather than by habit.
Putting the trends to work this quarter
- Audit what is instrumented today and where distributed tracing has gaps.
- Pick one slow, important transaction and trace it end to end as a benchmark for any tool you test.
- Set a telemetry budget before the next contract renewal.
- Add your LLM and agent workloads to the monitoring plan, even if the first version is basic.
How Narwal can help
Choosing an APM approach is easier with a partner who has done it across AI, data and quality engineering. Narwal helps enterprises design monitoring that fits their architecture, from OpenTelemetry instrumentation to AI-aware observability. If your current setup is slow to explain incidents or expensive to run, talk to our team about a review, or read our guide to application performance monitoring to see where to start.
Frequently Asked Questions
The main ones are OpenTelemetry adoption, the merging of APM and observability, AI-assisted root cause analysis, monitoring of LLM and agent workloads, and tighter control of telemetry costs.
Unlikely. AI agents depend on the traces, metrics and logs that APM tools collect, so they sit on top of monitoring rather than replacing it. Their usefulness depends on the quality of that underlying data.
Yes. OpenTelemetry is the standard way to produce and carry traces, and distributed tracing remains the main way to follow a request across services.
Start with latency, errors, token usage and cost for each model call, then add output quality checks. OpenTelemetry’s GenAI conventions offer a common way to record this, though they are still in development.
Not necessarily. Many of these changes start with better instrumentation, cleaner data and clearer cost controls, which you can improve before changing tools.
Related Posts

AI document processing: automating binder-to-policy review
Summary AI document processing can take the manual, field-by-field work out of binder-to-policy review, where quiet mismatches in commercial insurance are easy to miss. Narwal repurposed its existing RAG Bot accelerator into a placement-ready workflow…

- Oct 01
Application Performance Monitoring: The 2026 Guide to Key Metrics, Tools, and Root Cause Analysis
Modern applications rarely fail in one obvious place. A slow checkout page might trace back to a database query three services away. A spike in errors might be a downstream API silently timing out. Application…
- Sep 02


google-site-verification: google57baff8b2caac9d7.html

Headquarters
8845 Governors Hill Dr, Suite 201
Cincinnati, OH 45249
Our Branches
Cincinnati | Jacksonville | Indianapolis | London | Hyderabad | Bangalore | Pune
Narwal | © 2024 All rights reserved