
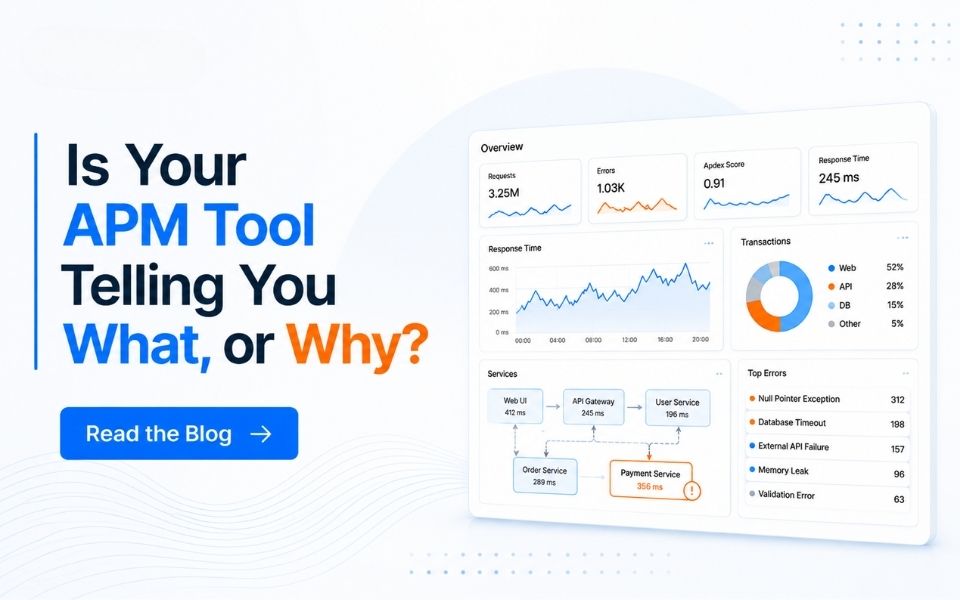
Modern applications rarely fail in one obvious place. A slow checkout page might trace back to a database query three services away. A spike in errors might be a downstream API silently timing out. Application Performance Monitoring (APM) exists to make that complexity visible before it becomes an outage. As architectures shift toward microservices, containers, and multi-cloud environments, that visibility has gone from a nice-to-have to a baseline requirement for running production software.
At Narwal, most of the APM conversations we have with clients don’t actually start with “we need a monitoring tool.” They start with “we have five monitoring tools and still can’t tell you why the app was slow yesterday.” That gap, between having data and having answers, is really what this guide is about.
Narwal’s Take: APM as a category was built to solve a collection problem: get the metrics, traces, and logs into one place. That problem is largely solved. The bottleneck we see in almost every engagement now is correlation and reasoning, turning a wall of telemetry into “here’s what broke and why,” fast enough to matter. That’s less a monitoring problem than an AI problem, and it’s the lens we bring to every APM engagement.
What Is Application Performance Monitoring?
Application performance monitoring (APM) is the practice of tracking, measuring, and analyzing the performance and availability of software applications in real time. At its core, APM answers three questions IT and engineering teams need answered continuously. Is the application available? Is it fast enough? And if something is wrong, where exactly is it broken?
APM tools do this by collecting telemetry, metrics, traces, and logs, from across an application’s stack: the code itself, the infrastructure it runs on, the databases it queries, and the APIs it depends on. That data is then correlated to give teams a single view of application health, rather than a fragmented set of signals from a dozen different systems.
The scope of APM has expanded significantly over the past several years. What used to mean monitoring a handful of servers running a monolithic application now covers distributed, cloud-native systems where a single user request might pass through dozens of services. This shift is part of why analyst coverage of the category has moved from “Application Performance Monitoring” toward “Application Performance Monitoring and Observability,” a distinction worth unpacking later in this piece. The label matters less than the outcome: can your team actually explain, in minutes rather than hours, why something broke?
Why Is Application Performance Monitoring Important?
As applications have grown more distributed, the cost of not knowing what’s happening inside them has grown with it. APM matters because it turns that uncertainty into something measurable and actionable, across seven areas that compound on each other. Most organizations already believe they’re covered on most of these. The honest test is the last one on this list: few teams can actually draw a straight line from an APM dashboard to a business metric a CFO cares about.
Improve application reliability
When teams can see performance data continuously rather than reactively, they catch degradation before it becomes an incident. Reliability stops being something you find out you lost and becomes something you actively maintain.
Improve customer experience
Application performance is inseparable from user experience. A slow page load or a failed transaction is something a customer feels directly, regardless of what caused it on the backend. APM connects technical performance to what users actually experience.
Detect performance problems earlier
Continuous monitoring surfaces anomalies, a creeping increase in latency, a memory leak building over hours, long before they cross the threshold into an outage.
Reduce downtime
Earlier detection compounds directly into less downtime. Teams that see a problem forming can often resolve it before it affects users at all.
Reduce MTTR
When an incident does happen, APM’s telemetry, traces, logs, and correlated metrics, gives teams a starting point instead of a blind investigation. Industry research on combined AIOps and observability has found it can cut mean time to repair by roughly half, which is the kind of gap APM visibility closes. The teams that struggle most with MTTR are rarely missing data. They’re missing correlation.
Improve developer and operations productivity
Less time spent manually correlating logs across systems means more time spent building. APM removes a significant amount of the investigative work that used to fall on engineers during an incident. This is also where a lot of APM investments quietly fail: teams buy the tool but never remove the manual correlation habits it was supposed to replace.
Connect application performance to business outcomes
Perhaps the most underrated benefit: APM gives non-technical stakeholders a way to see how application health maps to revenue, conversion, and customer retention, turning “the app is slow” into a business conversation with real numbers behind it. Research on combined AIOps and observability has also linked it to measurable gains in availability for revenue-generating applications, which is the kind of figure that makes this section land with a business audience, not just an engineering one.
How Does Application Performance Monitoring Work?
APM isn’t a single tool or dashboard. It’s a pipeline. Each stage builds on the last, turning raw signals from your application into an actionable understanding of what’s happening and why. The stage most teams underinvest in isn’t collection. It’s correlation. It’s easy to buy a tool that gathers data from everywhere. It’s harder to make that data tell one coherent story.
Application instrumentation
Code, frameworks, and infrastructure are instrumented, either through agents, SDKs, or open standards, so they emit data about what they’re doing as they run.
Telemetry collection
That instrumentation produces telemetry: metrics (numeric measurements over time), traces (the path a request takes through a system), and logs (discrete event records). APM platforms collect all three continuously.
Data aggregation and correlation
Raw telemetry from dozens of services is aggregated and correlated so it can be read as a single story, rather than reviewed system by system. This is the step where most legacy APM setups quietly break down. They collect plenty, but leave correlation to a human at 2 a.m.
Narwal’s Take: This is the exact stage where we typically get pulled in. Most stacks we inspect aren’t short on data. They’re short on a system that can reason across it the way a senior engineer would. That’s a pattern-matching and inference problem, and it’s squarely where our AI and data engineering work, the same semantic-layer and retrieval techniques we build for structured-data use cases, applies directly to telemetry.
Performance analysis
The correlated data is analyzed against baselines and expected behavior to identify what’s normal and what isn’t.
Alerting
When something falls outside expected thresholds, alerts route to the right team, ideally with enough context attached that the alert itself is a starting point for investigation, not just a notification.
Root-cause analysis
Teams use the correlated traces and logs to trace a problem back to its source: which service, which dependency, which change introduced it.
Remediation and continuous optimization
Once resolved, the same data feeds back into tuning thresholds, refining instrumentation, and preventing the same class of issue from recurring.
Key Application Performance Monitoring Metrics
Every stage of the APM pipeline above ultimately produces a set of core metrics. These are the numbers that tell you whether an application is healthy, and where to look when it isn’t. Teams new to APM tend to over-index on the first two. The ones that get the most value out of their tooling pay closer attention to Apdex and transaction-level data, because that’s where technical performance actually starts to look like business impact.
- Response time and latency. How long a request takes from initiation to completion, and where time is being spent along the way.
- Throughput. The volume of requests or transactions an application processes over a given period.
- Error rate. The proportion of requests that fail, time out, or return unexpected results.
- Availability. The percentage of time an application is up and able to serve requests, typically tracked against an uptime SLA.
- Apdex. A standardized index (Application Performance Index) that scores user satisfaction based on response-time thresholds, giving teams a single comparable number instead of raw latency figures.
- Transaction performance. How individual business transactions (a checkout, a login, a search) perform end to end, rather than just at the infrastructure level.
- Database performance. Query response times, connection pool health, and slow-query patterns, since database calls are a common source of latency.
- API performance. Response times and error rates for both internal and third-party API calls the application depends on.
- Resource utilization. CPU, memory, disk, and network usage, which often explain why a performance metric is degrading.
- User experience. Real-world performance as experienced by actual users, typically captured through Real User Monitoring rather than synthetic tests alone.
APM Tooling Architecture
Where the metrics above describe what APM measures, this section covers what kind of tooling actually captures it. Most APM platforms are really a set of specialized capabilities working together. One of the most common mistakes we see is organizations buying each of these separately, from different vendors, and never connecting them.
- Application monitoring. The core capability of tracking application-level health and performance.
- Real User Monitoring (RUM). Captures performance data from actual user sessions in the browser or mobile app, rather than simulated traffic.
- Distributed tracing. Follows a single request as it moves across services, giving teams a map of exactly where time was spent and where a failure occurred.
- Error tracking. Captures, groups, and prioritizes application errors and exceptions as they happen.
- Infrastructure monitoring. Tracks the health of the servers, containers, and cloud resources the application runs on.
- Log monitoring. Centralizes and indexes log data so it can be searched and correlated with metrics and traces.
- Database monitoring. Specifically tracks database query performance and health, given how often database calls are the source of latency.
- Dependency monitoring. Tracks the health of third-party services and APIs an application relies on.
- Alerting and dashboards. The layer that surfaces all of the above to the people who need to act on it, in real time.
Application Performance Monitoring vs Observability
APM and observability are related but not identical, and the distinction matters for how you evaluate tooling. APM traditionally focuses on known failure modes, tracking predefined metrics against applications you already understand. Observability is broader. It’s about being able to ask new questions of your system’s data even when you didn’t anticipate the failure mode in advance, using the combination of metrics, traces, and logs together.
In practice, the two have converged, and it’s not worth spending too much energy on the terminology debate. Most modern platforms marketed as “APM” now include observability capabilities, and analyst coverage of the space has shifted accordingly, treating observability as the umbrella and APM as one critical application within it. The more useful question isn’t which term applies to your stack. It’s whether your team can actually investigate something it didn’t anticipate. For a deeper look at what full observability maturity actually requires, see our guide to LLM Observability.
Narwal’s Take: We’d push this further than most vendors will. Observability without AI-assisted reasoning over the data is really just APM with more inputs. You’ve widened the funnel without doing anything about the bottleneck at the end of it. The organizations getting real value out of observability today are the ones pairing it with AI that can actually investigate on their behalf, not just surface more dashboards.
APM vs Application Performance Management
These terms are often used interchangeably, but they describe different scopes. Application Performance Monitoring refers specifically to the technical practice of collecting and analyzing performance data. Application Performance Management is the broader discipline. It includes monitoring, but also the processes, governance, and organizational practices built around using that data to actually improve application performance over time. In short, monitoring is the “what,” management is the “so what.” This distinction is where a lot of APM investments underdeliver. Organizations buy the monitoring and skip building the management practice around it.
APM for Modern Cloud-Native Applications
Cloud-native architectures, microservices, containers, serverless functions, changed what APM needs to do. A single user request in a cloud-native environment might touch a dozen independently deployed services, each scaling and failing independently of the others. Traditional APM approaches built around monitoring a single application process don’t map well onto that reality, and organizations still try to force legacy monitoring habits onto architectures those habits were never designed for.
Modern APM for cloud-native systems needs to handle ephemeral infrastructure (containers that exist for minutes, not months), dynamic service topologies that change with every deployment, and mobile and edge endpoints as extensions of the same application rather than separate concerns. This is also why mobile APM has increasingly been treated as one component of an organization’s broader APM and digital experience monitoring strategy, rather than a standalone discipline.
Application Performance Monitoring Best Practices
- Instrument early, not after problems appear. Retrofitting instrumentation onto a production system is harder and riskier than building it in from the start.
- Monitor business transactions, not just infrastructure. Knowing a server is healthy doesn’t tell you whether checkout is actually working.
- Set meaningful alert thresholds. Alert fatigue from noisy, poorly tuned thresholds is one of the fastest ways to make a monitoring investment ineffective, and one of the fastest ways teams start ignoring alerts altogether.
- Correlate across metrics, traces, and logs. Any one signal in isolation tells an incomplete story.
- Establish baselines before you need them. You can’t identify abnormal behavior without a clear picture of what normal looks like.
- Review and refine continuously. Thresholds, dashboards, and instrumentation coverage should evolve as the application does. Treating APM as a “set it up once” project rather than an ongoing practice is the single biggest reason monitoring investments go stale.
How to Choose an APM Tool
Selecting an APM platform typically comes down to a handful of factors: how well it supports your current and planned architecture (cloud-native, hybrid, legacy), whether it supports open standards like OpenTelemetry or locks you into proprietary agents, how it prices as you scale (per host, per user, per data volume), and how much AI-assisted analysis it offers for correlation and root-cause work versus leaving that entirely to your team. Evaluating vendors against your actual architecture, not a generic checklist, is usually the difference between a tool that gets adopted and one that gets abandoned after six months. Our advice to clients evaluating vendors is almost always the same: pilot against your worst recent incident, not a demo environment. If the tool can’t help you find that root cause faster than your team already did, the sales deck doesn’t matter.
Common Challenges With Application Performance Monitoring
Despite how mature APM as a category has become, most organizations haven’t actually reached full observability maturity. Recent industry surveys put that figure at roughly one in ten IT leaders. Common obstacles include tool sprawl (multiple overlapping monitoring tools that don’t share data), alert fatigue from poorly tuned thresholds, the sheer data volume produced by distributed systems outpacing teams’ ability to manually review it, and organizational silos where different teams own different pieces of the stack without a shared view.
This is a pattern we’ve seen up close. One healthcare technology client came to us with exactly this problem: a five-month-long gap between their AI infrastructure and their existing monitoring stack, with cost, usage, and model-quality data sitting in silos nobody had connected. The growing gap between the volume of telemetry modern systems produce and teams’ capacity to manually interpret it is a major reason AI-assisted analysis has become a standard expectation rather than a differentiator.
APM and OpenTelemetry
OpenTelemetry (OTel) has become the industry-standard open framework for instrumentation, giving teams a vendor-neutral way to collect metrics, traces, and logs. Its rise matters for APM specifically because it decouples instrumentation from any single vendor’s proprietary agent. Near-universal OTel support among APM vendors today means organizations can change monitoring platforms without re-instrumenting their entire codebase, reducing vendor lock-in as a factor in tool selection. We generally recommend clients treat OTel support as a non-negotiable line item in any vendor evaluation, not a nice-to-have.
How Narwal Can Help With Application Performance
Everything in this guide points to the same conclusion. The hard part of APM was never collecting telemetry. It’s making sense of it fast enough to act. That’s a data and AI problem before it’s a monitoring problem, and it’s exactly the intersection Narwal works in. We don’t build APM agents from scratch or replace your existing tooling. We apply the same AI and data engineering discipline we use for semantic layers and retrieval systems to the telemetry your stack already produces, so the correlation and root-cause work that normally eats hours of engineering time gets compressed into minutes. That discipline draws on both our AI and Data practices working together.
We’ve seen this same gap play out on the AI infrastructure side too, where it’s arguably even sharper. One healthcare technology client had launched a production AI platform with no working pipeline between their AI usage data (Snowflake Cortex) and their monitoring stack (Datadog), leaving leadership blind to cost, usage, and quality for nearly five months. We closed that pipeline, then built the executive dashboards, cost attribution reporting, and model-quality evaluation framework that gave the team real visibility for the first time. It’s the same underlying problem this whole guide is about: telemetry existed, but nobody had built the layer that turned it into an answer. Read the success story →
Frequently Asked Questions
Application performance monitoring (APM) is the practice of tracking, measuring, and analyzing software application performance and availability in real time using metrics, traces, and logs.
APM works by instrumenting applications to emit telemetry, collecting that data continuously, correlating it across services, analyzing it against baselines, alerting on anomalies, and using the same data for root-cause analysis and ongoing optimization.
Core APM metrics include response time and latency, throughput, error rate, availability, Apdex score, transaction performance, database performance, API performance, resource utilization, and user experience.
APM focuses on tracking known metrics against applications you already understand. Observability is the broader capability to investigate unanticipated issues using the combination of metrics, traces, and logs together. Most modern tooling now blends both.
Choosing an APM tool comes down to how well it fits your architecture, whether it supports open standards like OpenTelemetry, how its pricing scales with your data volume, and how much AI-assisted analysis it offers for correlation and root-cause work.
Related Posts

AI document processing: automating binder-to-policy review
Summary AI document processing can take the manual, field-by-field work out of binder-to-policy review, where quiet mismatches in commercial insurance are easy to miss. Narwal repurposed its existing RAG Bot accelerator into a placement-ready workflow…

- Oct 01
How Narwal Helped a Leading Healthcare Technology Company Build AI Observability and Governance into its AI Platform
Summary Narwal.ai helped a leading US-based healthcare technology company transform its production AI platform from a black box into a measurable enterprise system. By embedding AI observability, cost visibility, adoption analytics, and model-quality governance into…
- Aug 20
Categories
Latest Post


AI document processing: automating binder-to-policy review
- October 1, 2026


How AI Tests AI: Inside Autonomous Quality Engineering
- September 18, 2026
google-site-verification: google57baff8b2caac9d7.html

Headquarters
8845 Governors Hill Dr, Suite 201
Cincinnati, OH 45249
Our Branches
Cincinnati | Jacksonville | Indianapolis | London | Hyderabad | Bangalore | Pune
Narwal | © 2024 All rights reserved